Module 5: Summary Statistics and Basic Plots in R
Summary statistics refer to the creation of commonly used aggregate statistics from a data frame, in this case a data frame of AAPL prices for the last ten years. In this module R will be used to load the AAPL prices then explore this data using summary statistics and some rudimentary plots.
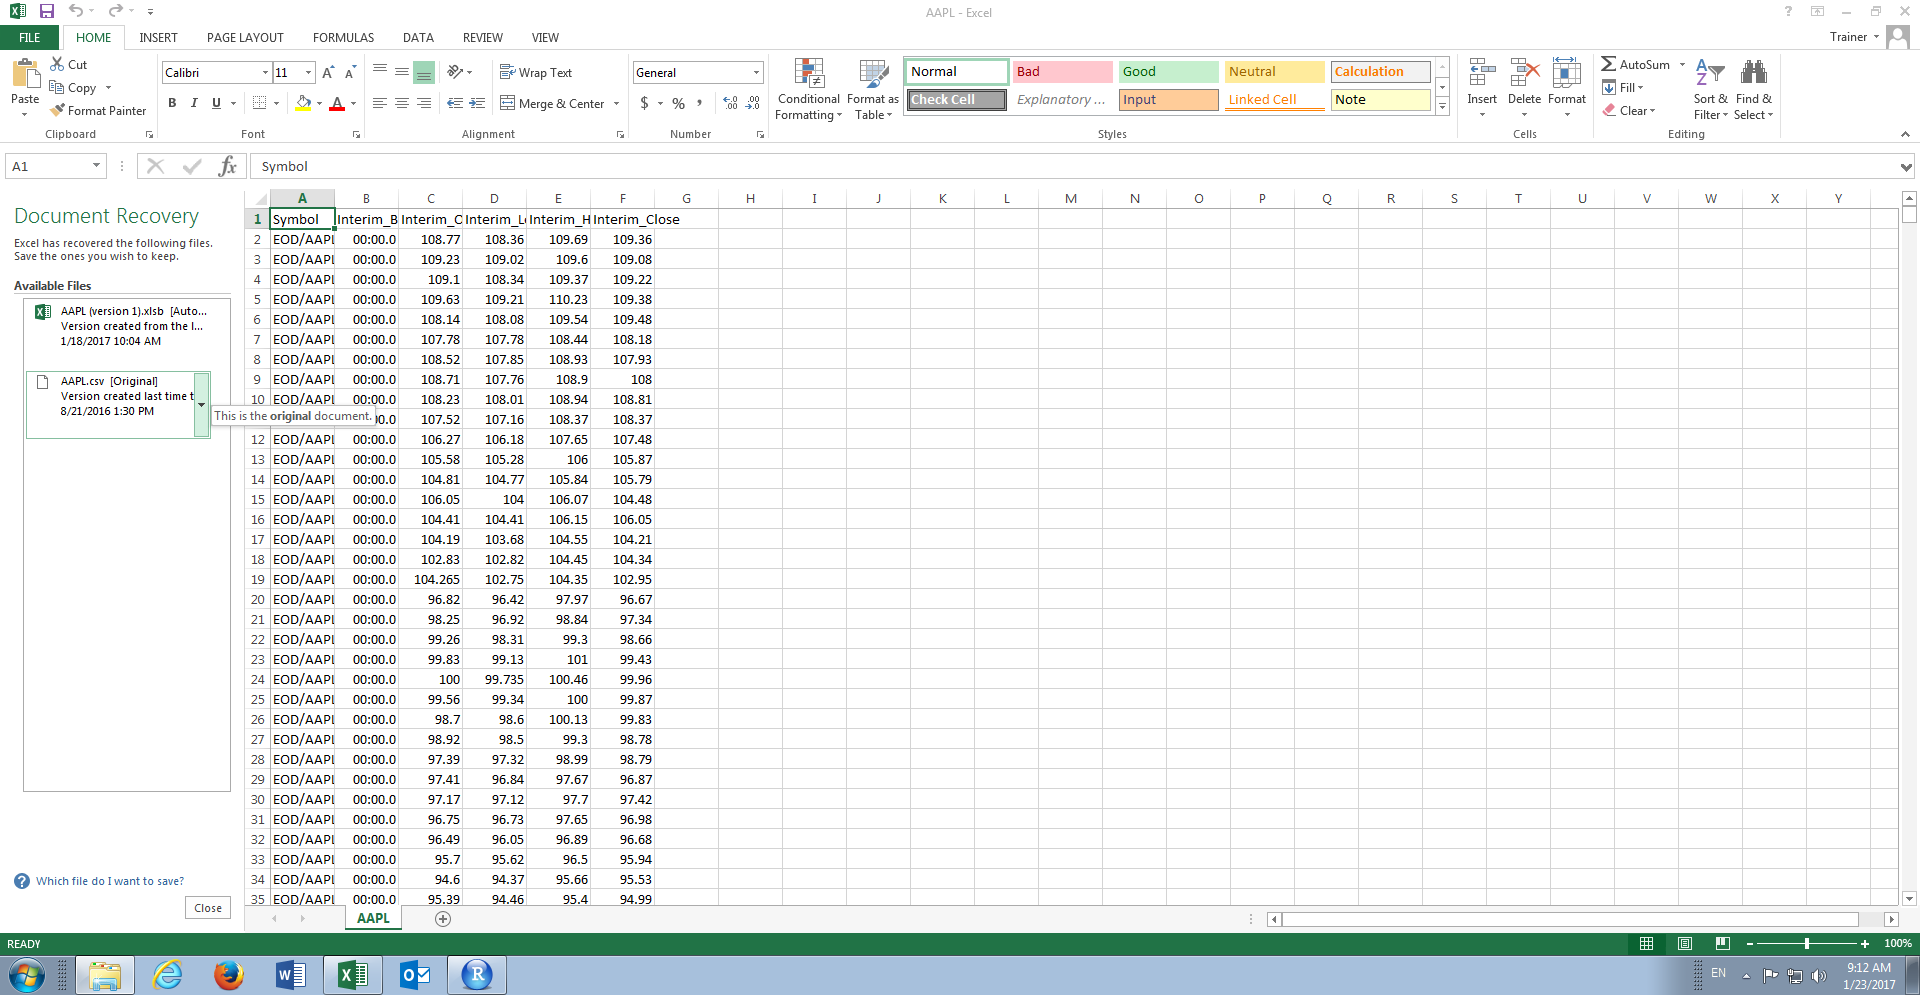
The data file to be used is the AAPL.csv file located in Bundle\Data\Equity\Equity\AAPL.csv:
The module seeks to emulate many of the functions available to Excel Analysis Toolpack or StatTools in R.
Table of contents
- Slides
- Procedure 1: Create a Histogram of Time Series Data in R
- Procedure 2: Establish Range in R
- Procedure 3: Calculate Quartiles and the Interquartile Range
- Procedure 4: Establish the Mean and Median in R
- Procedure 5: Create a Box Plot
- Procedure 6: Navigate Plots and Export Visualisations
- Procedure 7: Create the Variance and Standard Deviation
- Procedure 8: Calculate a Z Score
- Procedure 9: Create a Range Normalisation for a Value
- Procedure 10: Create the Skewness and Kurtosis statistics
- Procedure 11: Create Probabilities from a test value in a normal distribution