Procedure 5: Create a Box Plot
A box plot is a five-point visualisation of several summary statistics, the Median, the Range and the Quartile Range. The box plot allows for a quick appraisal of range and skew of the data and is an alternative to a histogram relying solely on easily reproducible summary statistics.
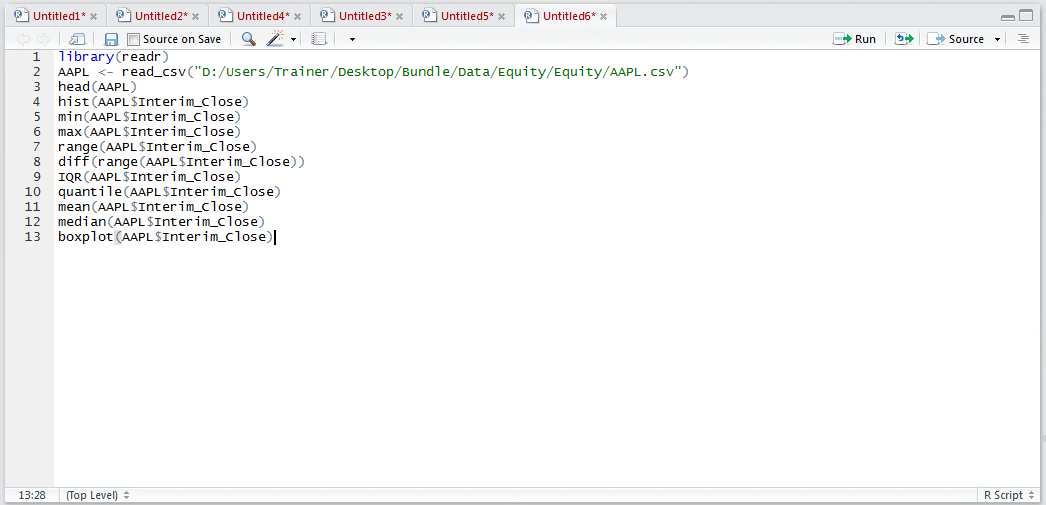
The boxplot() function takes a vector as its argument and produces a visualisation. To create a Box Plot simply type:
boxplot(AAPL$Interim_Close)
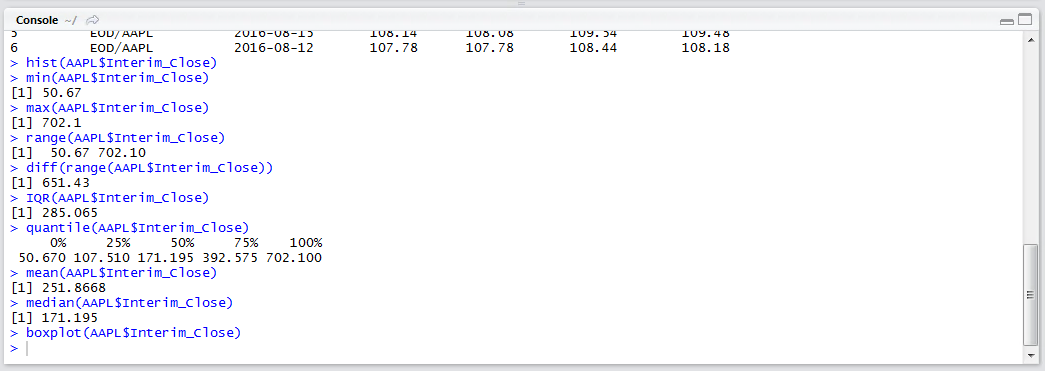
Run the line of script to console:
The box plot is drawn in the plots window in RStudio:
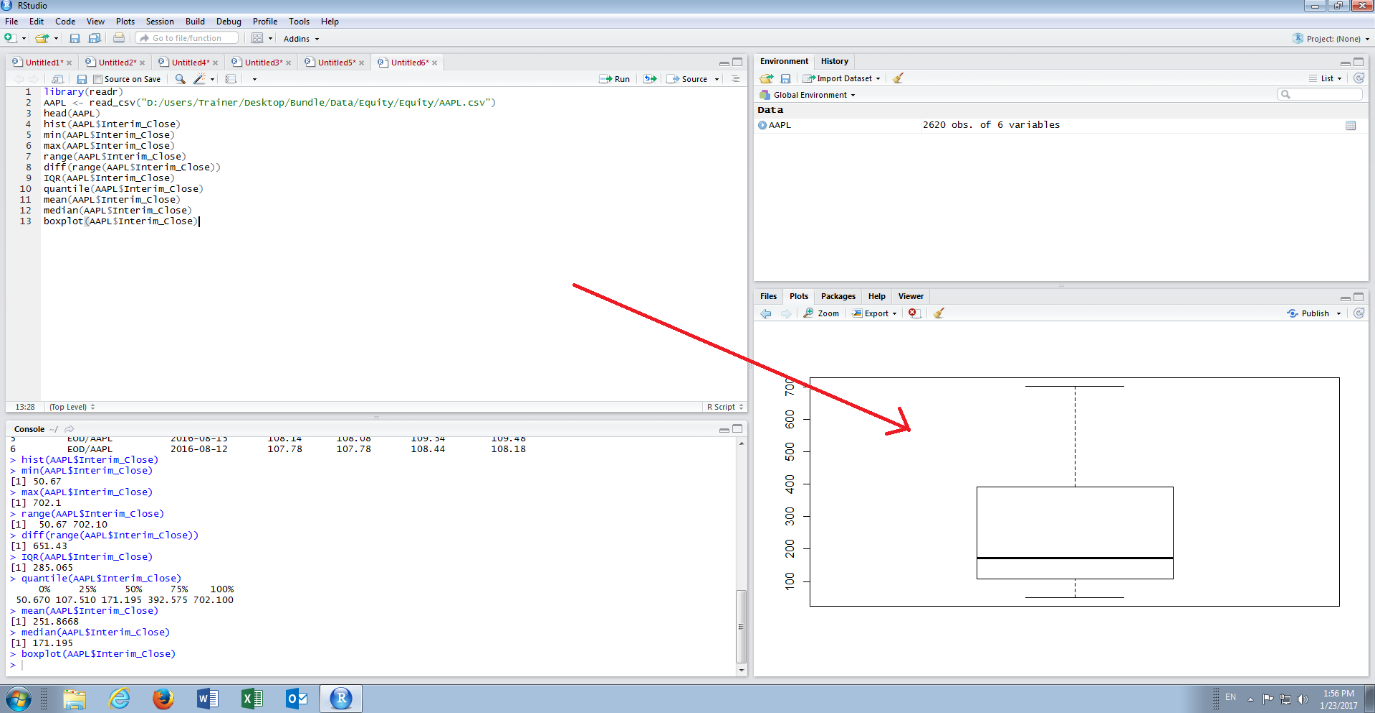
The upper and lower whiskers of the Box Plot represent the minimum and maximum values observed, the upper and lower extremes of the box represent quartile 3 and 1 and lastly the thick horizontal line represents the median. In this example, it can be observed that there is a skew, or compression, towards the lower values.