Procedure 9: Grading the ROC Performance with AUC
Visually the plot created suggests a that the model created has some predictive power. A more succinct method to measure model performance is the Area Under Curve statistics which can be calculated with ease by requesting “auc” as the measure to the performance object:
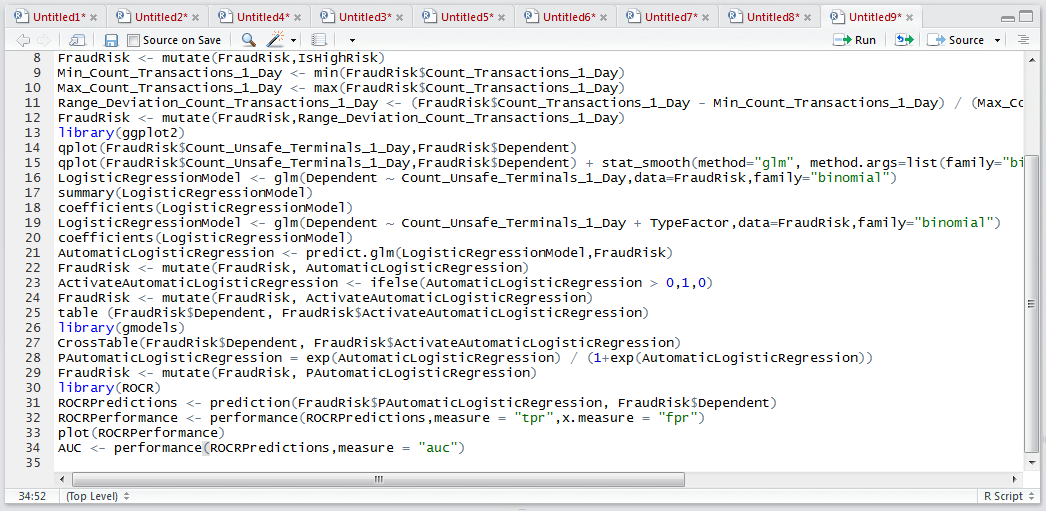
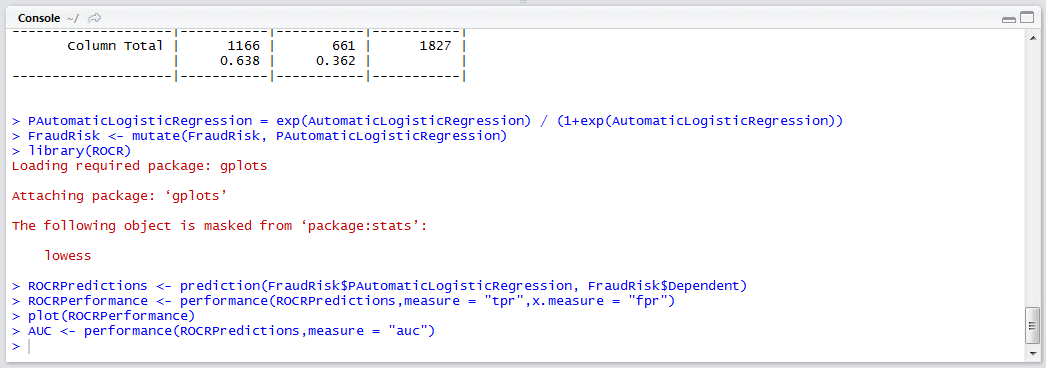
AUC <- performance(ROCRPredictions,measure = "auc")
Run the line of script to console:
To write out the contents of the AUC object:
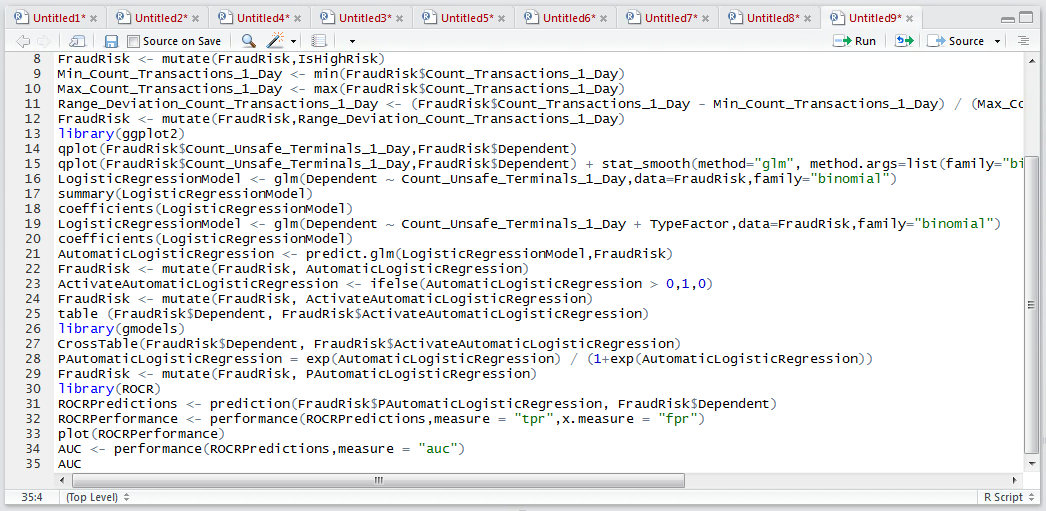
AUC
Run the line of script to console:
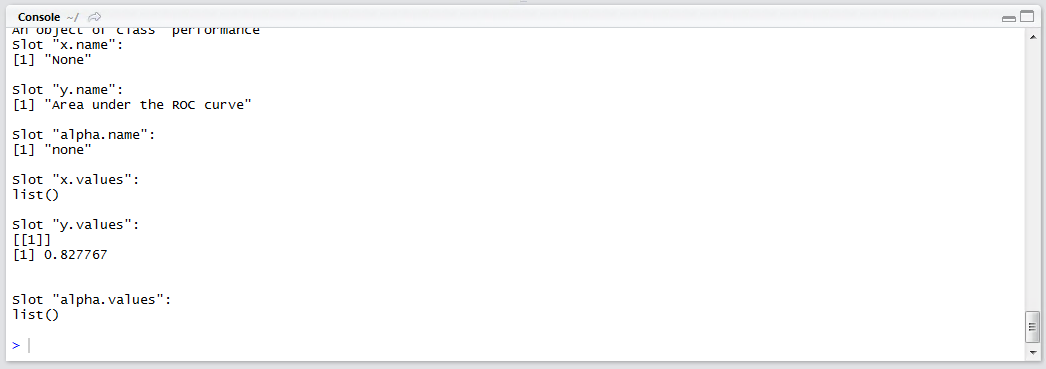
The value to gravitate towards is the y.values, which will have a value ranging between 0.5 and 1:
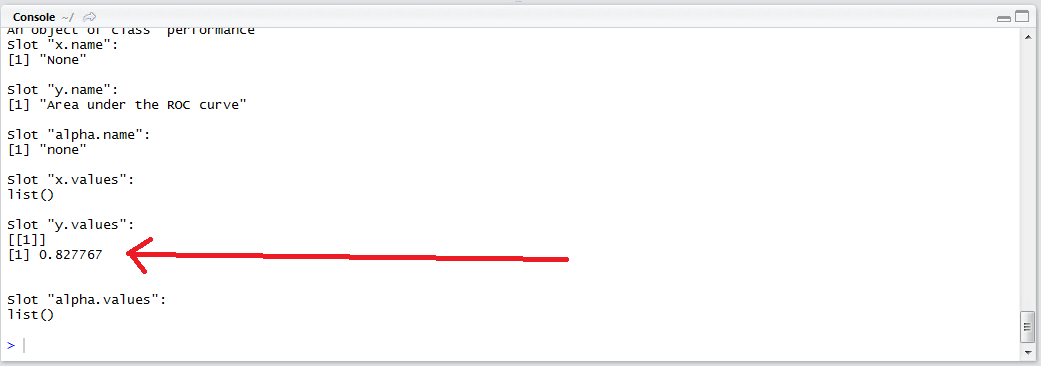
In this example, the AUC value is 0.827767 which suggests that the model has an excellent utility. By way of grading, AUC scores would correspond:
- A: Outstanding > 0.9
- B: Excellent > 0.8 and <= 0.9
- C: Acceptable > 0.7 and <= 0.8
- D: Poor > 0.6 and <= 0.7
- E: Junk > 0.5 and <= 0.6